Waveform Charting
XChart is a charting control specifically designed for data acquisition applications. It provides engineers and scientists with a powerful, easy-to-use scroll chart component that can be integrate seamlessly into their applications.
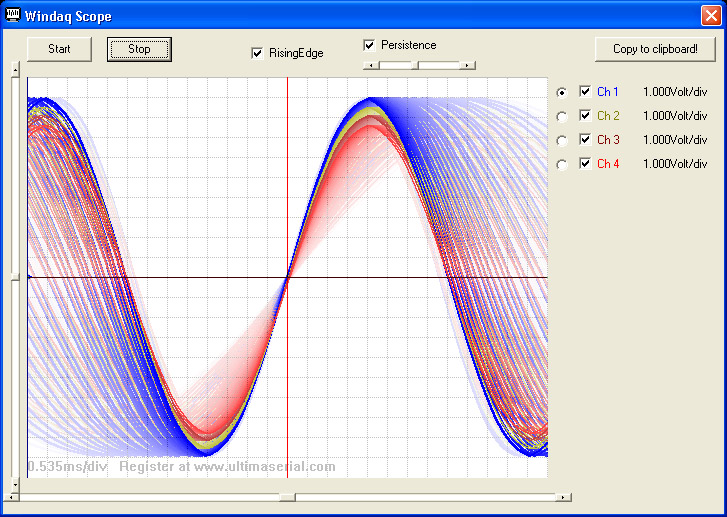
Teaser video of the component being used in WinDaq add-ons
Key Features
- Data in the format of 16-bit signed integer
- Any combinations, up to 16 waveforms, or channels, in a chart
- Analog oscilloscope-like fading option to show trends
- Copy image to clipboard
- Scrolling and sweeping
- Cursors or cross-hair
- Group or individual waveform offsetting and scaling
- Drag-and-drop waveform(s)
- Scaling is only one-click away
- User text anywhere on the chart
- Color legends for each waveform
- Analog or digital plot
- Flexible X and Y grid spacing
- Color selection for each waveform
- Doubling width for active waveform
- Auxiliary lines to the chart
- More features in Key property
License:
Freeware
Starting 2017, you can use this utility to remove the adline yourself
Installation:

-
The package contains FFT1024, XChart, UltimaWaterfall and UltimaMeter, executable demos and VB samples for the charting utilities. The waveforms are generated artificially, making it a good starting point to incorporate these charting utilities with any user data.
-
Here are the two VBX2008 projects for reference (VB6 examples comes with the installations). For other languages, please check this out
Examples
-
Two VB6 sample programs are included if you install Charting controls for everyone. If you use Visual Basic 2008 Express Edition, please get the source codes from here
-
demo_xchart: demonstrate how to create an user data array to send data to XChart.
-
demo_waterfall_1024: demonstrate how to create a waveform for FFT1024 and Ultimawaterfall
-
-
You can also find it being used in Sound Analyzer package, which uses the microphone on PC to display the spectrogram of audio signal
32 or 64-bit?
All UltimaSerial ActiveXs are 32-bit components, you must select 32-bit code option when using 64-bit compilers. Both 32-bit and 64-bit Windows runs 32-bit applications properly.
Properties and Methods:
denotes new features comparing to DQChart. For users familiar with DATAQ's DQChart, XChart is like a super set of DQChart. With minimum modification, you can immediately replace DQChart with XChart.
Demonstrated in the source codes of Windaq oscilloscope add-on
Demonstrated in the source codes of Windaq oscilloscope add-on
short Channel: Index of channel to plot, analog or digital. To plot a digital channel, Channel must be specified, and DigitalMask should be used. For analog channel, you may use ChannelMask to select the channel combination. If this number is -1, all channels (up to 16) will be used for analog charting.
XChart.Channel = -1
XChart.Chart A
This will plot all (up to 16) channels from AXChart.Channel = 1
XChart.Chart A
This will plot only the second channel from A. The channel property is now the index to the channels, where the first channel is indexed as 0.
Demonstrated in the source codes of Windaq oscilloscope add-on
Demonstrated in the source codes of Windaq oscilloscope add-on
To remove the ad-line , please register Ultimaserial package
Copy2Clipboard: Copy the current image to the clipboard.
boolean DigitalMask: To select a digital bit for plotting when Channel specifies a channel, i.e. Channel >=0
XChart.Channel=1
XChart.DigitalMask=2
XChart.Chart A
This will plot bit 1 of the second channel.
Negative number will be treated as 100th pixel. For example, -2320 will be 23.20 pixels. -1423 will be 14.23 pixels. Maximum negative number is -32768, or 327.68 pixel
Maximum negative number is -32768, or 327.68 pixelNegative number will be treated as 100th pixel. For example, -2320 will be 23.20 pixels. -1423 will be 14.23 pixels.
![]() boolean GroupSetting: When set,
the
mouse/button scaling and offsetting
operation
will be applied to all the
traces in the chart. Otherwise, only the
ActiveChannel will be
affected.
boolean GroupSetting: When set,
the
mouse/button scaling and offsetting
operation
will be applied to all the
traces in the chart. Otherwise, only the
ActiveChannel will be
affected.
Demonstrated in the source codes of Windaq oscilloscope add-on
boolean Lock: When set, mouse scaling and offsetting operation will be disabled. Instead, the mouse position will be reported in CrossHair(offset) event when left button is pressed, and a vertical cursor will be displayed
Demonstrated in the source codes of Windaq oscilloscope add-on
![]() OLE_COLOR PEraseBar: Defines the color
palette for the erase bar
OLE_COLOR PEraseBar: Defines the color
palette for the erase bar
![]() OLE_COLOR PGrid: Defines the color palette
for the gridlines
OLE_COLOR PGrid: Defines the color palette
for the gridlines
![]() OLE_COLOR PText: Defines the color palette
for the auxiliary text
OLE_COLOR PText: Defines the color palette
for the auxiliary text
![]() boolean ScrollMode: When set,
left-moving scroll mode is enabled, otherwise, erase/scope mode is
enabled
boolean ScrollMode: When set,
left-moving scroll mode is enabled, otherwise, erase/scope mode is
enabled
Demonstrated in the source codes of Windaq oscilloscope add-on
![]() boolean ShowEraseBar: When set,
the erase bar will be displayed in erase/scope mode.
boolean ShowEraseBar: When set,
the erase bar will be displayed in erase/scope mode.
boolean ShowLegend: When set, the color legends for each enabled channel will be displayed
Demonstrated in the source codes of Windaq oscilloscope add-on
![]() boolean SolidBaseLine: When set,
the horizontal gridline in the center of the chart will be a solid
one
boolean SolidBaseLine: When set,
the horizontal gridline in the center of the chart will be a solid
one
Demonstrated in the source codes of Windaq oscilloscope add-on
short Step: Number of data points to skip, if this number is a negative number S (minimum -4), each data point will be duplicated S times.
XChart.Step = 2
This will compress the waveform on time-axis by skipping every other points XChart.Step = -2
This will enlarge the waveform on time-axis by duplicating every points twice
long Xmax: Returns the width of the chart in number of pixels
Demonstrated in the source codes of Windaq oscilloscope add-on
![]() boolean SumWaveforms: When set,
the trace in
boolean SumWaveforms: When set,
the trace in
Demonstrated in the source codes of Windaq oscilloscope add-on
![]() boolean DoubleActiveTrace:
When set, the active trace will be highlighted.
boolean DoubleActiveTrace:
When set, the active trace will be highlighted.
Demonstrated in the source codes of Windaq oscilloscope add-on
![]() short Persist: Persist delay factor when
SumWaveforms
is set. 0 to be infinity, 255 to be minimum
persist delay, older waveforms fade away each time a new waveform is
added to the chart, according to this factor (See the top of this page
for visual effect).
short Persist: Persist delay factor when
SumWaveforms
is set. 0 to be infinity, 255 to be minimum
persist delay, older waveforms fade away each time a new waveform is
added to the chart, according to this factor (See the top of this page
for visual effect).
Demonstrated in the source codes of Windaq oscilloscope add-on
![]() BSTR Key:
BSTR Key:
-
Enter the license Key: XChart displays an ad-line at the end of ChartText unless Ultimaserial package is registered.
-
Enter command Keys
-
Add up to 256 auxiliary lines to the chart. see demo for more detail
-
Command key format is "A, <color1>, <xhead1>, <yhead1>,<xtail1>,<ytail1>,<color2>, <xhead2>, <yhead2>,<xtail2>,<ytail2>....", where
-
colorn=-1 to disable the auxiliary line
-
x position is the offset regarding to the left of the chart
-
y position is relative to the data, meaning it takes the offset and scaling of the chart into account
-
Because the auxiliary lines are added to the background, not updated on the fly, please do not change the scaling and offset of the waveform. Or, force the chart a fresh start when scaling and offset are changed by issuing XChart1.ScrollMode = XChart1.ScrollMode
For example: xchart1.key="A,255,0,0,255,25000,60928,0,0,255,-25000"
-
-
Digital Plot with format.
-
Command key format is "D, <digital mask>", see demo for more detail
-
For example, Key ="D, -1" evenly plots all 16 digital bits of the channel specified under Channel property
-
This command is a superset of the digitalmask property, and it only works under Chart method.
-
In this mode, you can't change the offset and scaling of the waveform. The lowest unmasked bit is plotted on top, and the highest unmasked bit is in the bottom
-
Example:
XChart.Channel=0
XChart.Key ="D,-1"
XChart.Chart v
-
-
Returns Erase bar location.
-
Command key format is "s"
-
Location is returned via ChartText property
-
Example:
XChart1.Key ="s"
EraseBarLocation = val(XChart.ChartText)
-
This is a one-shot operation, meaning once XChart.ChartText is retrieved, a second "s" command key is needed to retrieve the Erase bar location again.
-
Force the Y grids to start in the middle of the chart (default)
-
Command key format is "c"
-
Example:
XChart1. Key ="c"
-
Force the Y grids to start from the top of the chart
-
Command key format is "t"
-
When enabled, Baseline will not be displayed
-
Example:
XChart1. Key ="t"
-
Override the channel count when using one-dimensional array as input for Chart method. Some data acquisition drivers may return one-dimensional data array even when multiple channels are enabled. The data in the array are interleaved. In this case, instead of allowing Chart to determine the number of channels by examining the array dimension, one can use this token to specify the number of channels in the array.
-
Command key format is "@, <channelcount>"
-
Example:
dim mydata (100) as Integer
XChart1.Key ="@,4"
XChart1.Chart (mydata)
the above will force the one-dimensional array (mydata) be charted as a four-channel waveforms. The data in the one-dimensional array is assumed interleaved and always terminated at scan-boundary, where scan is the orderly collection of one sample from each channel.
-
-
void Chart(VARIANT Data): Chart the data, the
data can be a single
'VB6 onlyDim vv(3, 100) As Integer
'fill the array with your own waveform
XChart.Chart (vv)
void ChartEx(short* Buffer, short Channel, short Total): Chart the data
, which must be in the format of 16-bit integers. Please avoid this method if you are starting a new project since this approach is NOT encouraged under .NET environment thus this method is in code freeze stateBuffer is the address of the 16-bit integer array
Channel is the number of channels of the array
Total is the number of data in each channel
![]() void CopyToClipboard(void): Copy the image to
clipboard.
void CopyToClipboard(void): Copy the image to
clipboard.
Demonstrated in the source codes of Windaq oscilloscope add-on
![]() OLE_COLOR PLine(short Idx): Specify or
retrieve the color palette of traces
OLE_COLOR PLine(short Idx): Specify or
retrieve the color palette of traces
Demonstrated in the source codes of Windaq oscilloscope add-on
![]() void SetTextPos(short X, short
Y)
void SetTextPos(short X, short
Y)
Demonstrated in the source codes of Windaq oscilloscope add-on
long Ymax(short Idx): Specify or retrieve the maximum of a trace in relative to the chart
Change the Ymax and Ymin properties of XChart by the same steps, say 100
XChart.Ymax(0) = DQChart.Ymax(0) - 100
XChart.Ymin(0) = DQChart.Ymin(0) - 100
Watch: The screen will be cleared before the new waveform comes in when you do that
long Ymin(short Idx): Specify or retrieve the minimum of a trace in relative to the chart
Demonstrated in the source codes of Windaq oscilloscope add-on
![]() long BaseLine(short Idx): Specify the baseline
for a trace
long BaseLine(short Idx): Specify the baseline
for a trace
Demonstrated in the source codes of Windaq oscilloscope add-on
![]() void AuxCrossHair(short X,
short Y): Add an auxiliary cross hair to the chart if X or Y are
positive numbers. Note, the auxiliary cross hair will only update when a
new waveform plots
void AuxCrossHair(short X,
short Y): Add an auxiliary cross hair to the chart if X or Y are
positive numbers. Note, the auxiliary cross hair will only update when a
new waveform plots
Demonstrated in the source codes of Windaq oscilloscope add-on
Event
ChartChanged(long Min, long Max): The scaling is changed for the active channel (ungrouped), or all channels ( grouped) due to mouse/button scaling and button operation
Demonstrated in the source codes of Windaq oscilloscope add-on
CrossHair(long Offset): Report the mouse button position
-
When Lock is set, and left button is pushed down, this reports the X position of the mouse pointer. Demonstrated in the source codes of Windaq oscilloscope add-on
-
When right button is pushed down, this reports -(XPosition + (YPosition+1)*60000)
Mouse/Button scaling/offsetting operation
When XChart.Lock = FALSE, You can use your mouse to the waveform up & down. When you push down the left button, you will see the shifting level indicator on the chart.
To change the scale of the waveform, double-click the Left/Right mouse button to increase/decrease the amplitude of the waveform(s).
ChartChanged event will be fired when the scale or offset changes
Frame Rate
With the latest Windows, you can use timer to send data to XChart at a very high rate, but due to the way human eyes processing images, 25 fps is usually good enough. As the result, while you can create a thread to acquire data at high speed, you may want to create a timer with lower frequency for charting purpose so that you don't use add a heavy load to the CPU.
.NET users:
Last update: 07/26/24
© www.ultimaserial.com